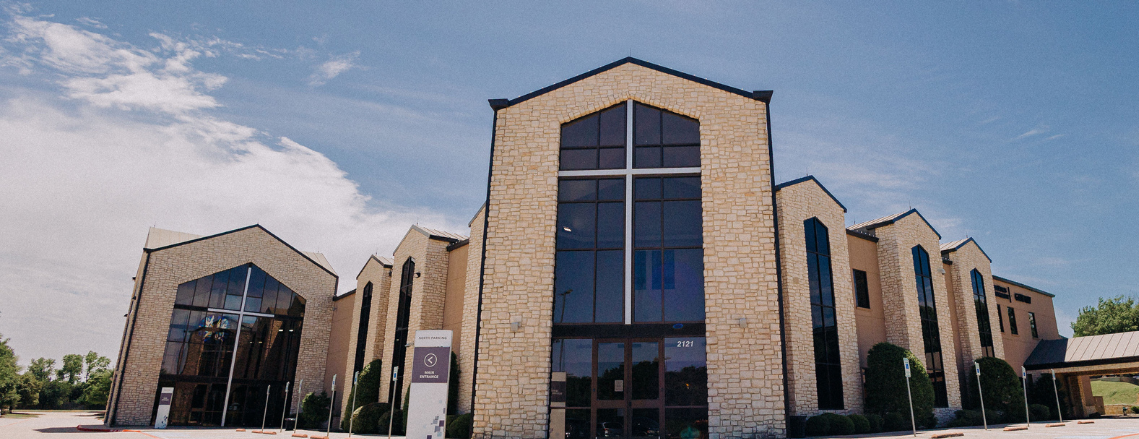
The King's University
Student Achievement Data for The King’s University (TRACS)
NOTE: TKU traditionally has a small number of first-time, full-time students. Our students are primarily non-residential commuters, often bi-vocational and enrolling with transfer credits.
Retention Rates
| Program | 2025–2026 | 2024–2025 | 2023–2024 | 3-yr Average |
|---|---|---|---|---|
| Associate | 40.0%*,** | 66.7%** | 25.0%** | 45.9%** |
| Bachelor | 62.1%* | 61.5% | 61.9% | 61.7% |
| Graduate | 75.9%* | 67.3% | 70.9% | 69.1% |
Retention is academic year to academic year for first-time entering students: a student who first enrolled in any term of the entry year (fall, spring or summer) is retained if enrolled in any term of the following year or has completed an award. Graduate includes master's and doctoral programs.
Graduation Rates
This section presents data for graduation rates of first-time, full-time degree seeking students as reported in the TRACS Annual Operating Report.** The completion and graduation rates for associate, bachelor, and graduate degrees are measured at 150% of the expected time for completion (bachelor degree rate is 6 years from the first enrollment).
| Program | 2020 cohort | 2019 cohort | 2018 cohort | Average |
|---|---|---|---|---|
| Associate | 0.0%** | 12.5%** | 0.0%** | 4.2%** |
| Bachelor | 30.4% | 18.2% | 25.0% | 24.5% |
| Graduate | 50.5% | 42.1% | 44.9% | 45.8% |
Graduation rates reflect completion within a 6-year window for each academic-year entering cohort (fall, spring and summer entrants), counting awards conferred in any term. Graduate includes master's and doctoral programs.
MAMFT Licensure Pass Rates
This section presents licensure pass rates for the students in the Master of Arts in Marriage and Family Therapy program.
| Academic Years | # of Students Graduated | % Attempting LPC Exam | % LPC Pass Rate | % Atempting LMFT Exam | % LMFT Pass Rate |
| 2025-2026 | 27 | 66.00% | 93% | 3.50% | 100% |
| 2024-2025 | 9 | 80% | 87.50% | n/a | n/a |
| 2023-2024 | 16 | 56% | 89% | 6% | 100% |
| 2022-2023 | 18 | 67% | 100% | 6% | 100% |
| 2021-2022 | 15 | 67% | 100% | 7% | 100% |
| 2020-2021 | 13 | 46% | 100% | 15% | 50% |
| 2019-2020 | 13 | 69% | 100% | 23% | 100% |
| 2018-2019 | 14 | 71% | 100% | n/a | n/a |
| Averages: | 14 | 65% | 96% | 10% | 92% |
**NOTE: Pass Rates are based on if a student passes an exam on the 1st attempt. We do not always know if/when a student or alumni has attempted either exam or retaken an exam if they did not passed the 1st try. The Counseling Dept regularly reaches out to alumni to keep up with their licensure.
The King's Seminary
The King's University publishes the following student achievement data for the degree programs of The King's Seminary accredited by the Association of Theological Schools (ATS). Figures cover seminary degree programs only and are updated annually.
Retention Rates
| Program | Entered 2025–2026 | Entered 2024–2025 | Entered 2023–2024 | 3-year average |
|---|---|---|---|---|
| MDiv | 83.3%* | 68.4% | 83.3% | 75.8% |
| MOL and MPT | 66.7%* | 68.4% | 75.0% | 71.7% |
| MTS | 100.0%*,** | 50.0%** | 70.0% | 60.0%** |
| DMin | 90.0%* | 86.7% | 88.9% | 87.8% |
Retention is academic year to academic year: a student who entered the program in any term of the entry academic year (fall, spring or summer) is retained if enrolled for credit in any term of the following academic year or has completed an award. Program rows are by the program entered; MDiv, MOL and MPT, and DMin include their concentration and WIML tracks.
Persistence Rates
Persistence rates are the number of students graduated plus number of students still enrolled divided by # of students entered.
| Program | Entering cohort | Students entered | Persistence rate |
|---|---|---|---|
| MDiv | Entered 6 years ago (2020–2021) | 33 | 45.5% |
| MOL and MPT | Entered 4 years ago (2022–2023) | 27 | 63.0% |
| MTS | Entered 4 years ago (2022–2023) | 6 | 16.7%** |
| DMin | Entered 6 years ago (2020–2021) | 10 | 40.0% |
Persistence is the share of an entering cohort who, at the end of the measurement window, have graduated with the degree they began, graduated with another degree, or are still enrolled. Cohorts are entering academic-year cohorts measured at roughly 200% of normal program time, following the ATS Annual Report Form definition: MDiv and DMin six years after entry, MOL, MPT and MTS four years after entry.
Graduation Rates
This section presents data for graduation rates of students as reported in the ATS Annual Report for students who graduated with the degree they began with. The completion and graduation rates for associate, bachelor, and graduate degrees are measured at 150% of the expected time for completion.
| Program | Entering cohort | Students entered | Graduation rate |
|---|---|---|---|
| MDiv | Entered 6 years ago (2020–2021) | 33 | 24.2% |
| MOL and MPT | Entered 4 years ago (2022–2023) | 27 | 51.9% |
| MTS | Entered 4 years ago (2022–2023) | 6 | 16.7%** |
| DMin | Entered 6 years ago (2020–2021) | 10 | 40.0% |
Graduation rate is the share of the same entering cohort who have graduated with the degree they began within the measurement window (MDiv and DMin six years after entry, MOL, MPT and MTS four years after entry). Students who completed a different degree or are still enrolled count toward persistence but not toward graduation.
Job Placement Rates
Graduates from the 2023-2024 class who found placement either vocational, non-vocationally or were seeking further study based on the responses from the Graduating Student Survey are as follows:
| Academic Program | 2022-2023 | 2023-2024 | 2024-2025 |
| MDiv Students | 49% | 50% | 62% |
| MOL & MPT Students | 80% | 88% | 92% |
| MTS Students | 50% | N/A | 75% |
| DMin Students | 80% | 87% | 95% |